Markdown + mindmap: visualize your Markdown with Markmap.
The outline you already wrote is already a mind map. Markmap just draws it — foldable, searchable, and exportable as an interactive file anyone can open.
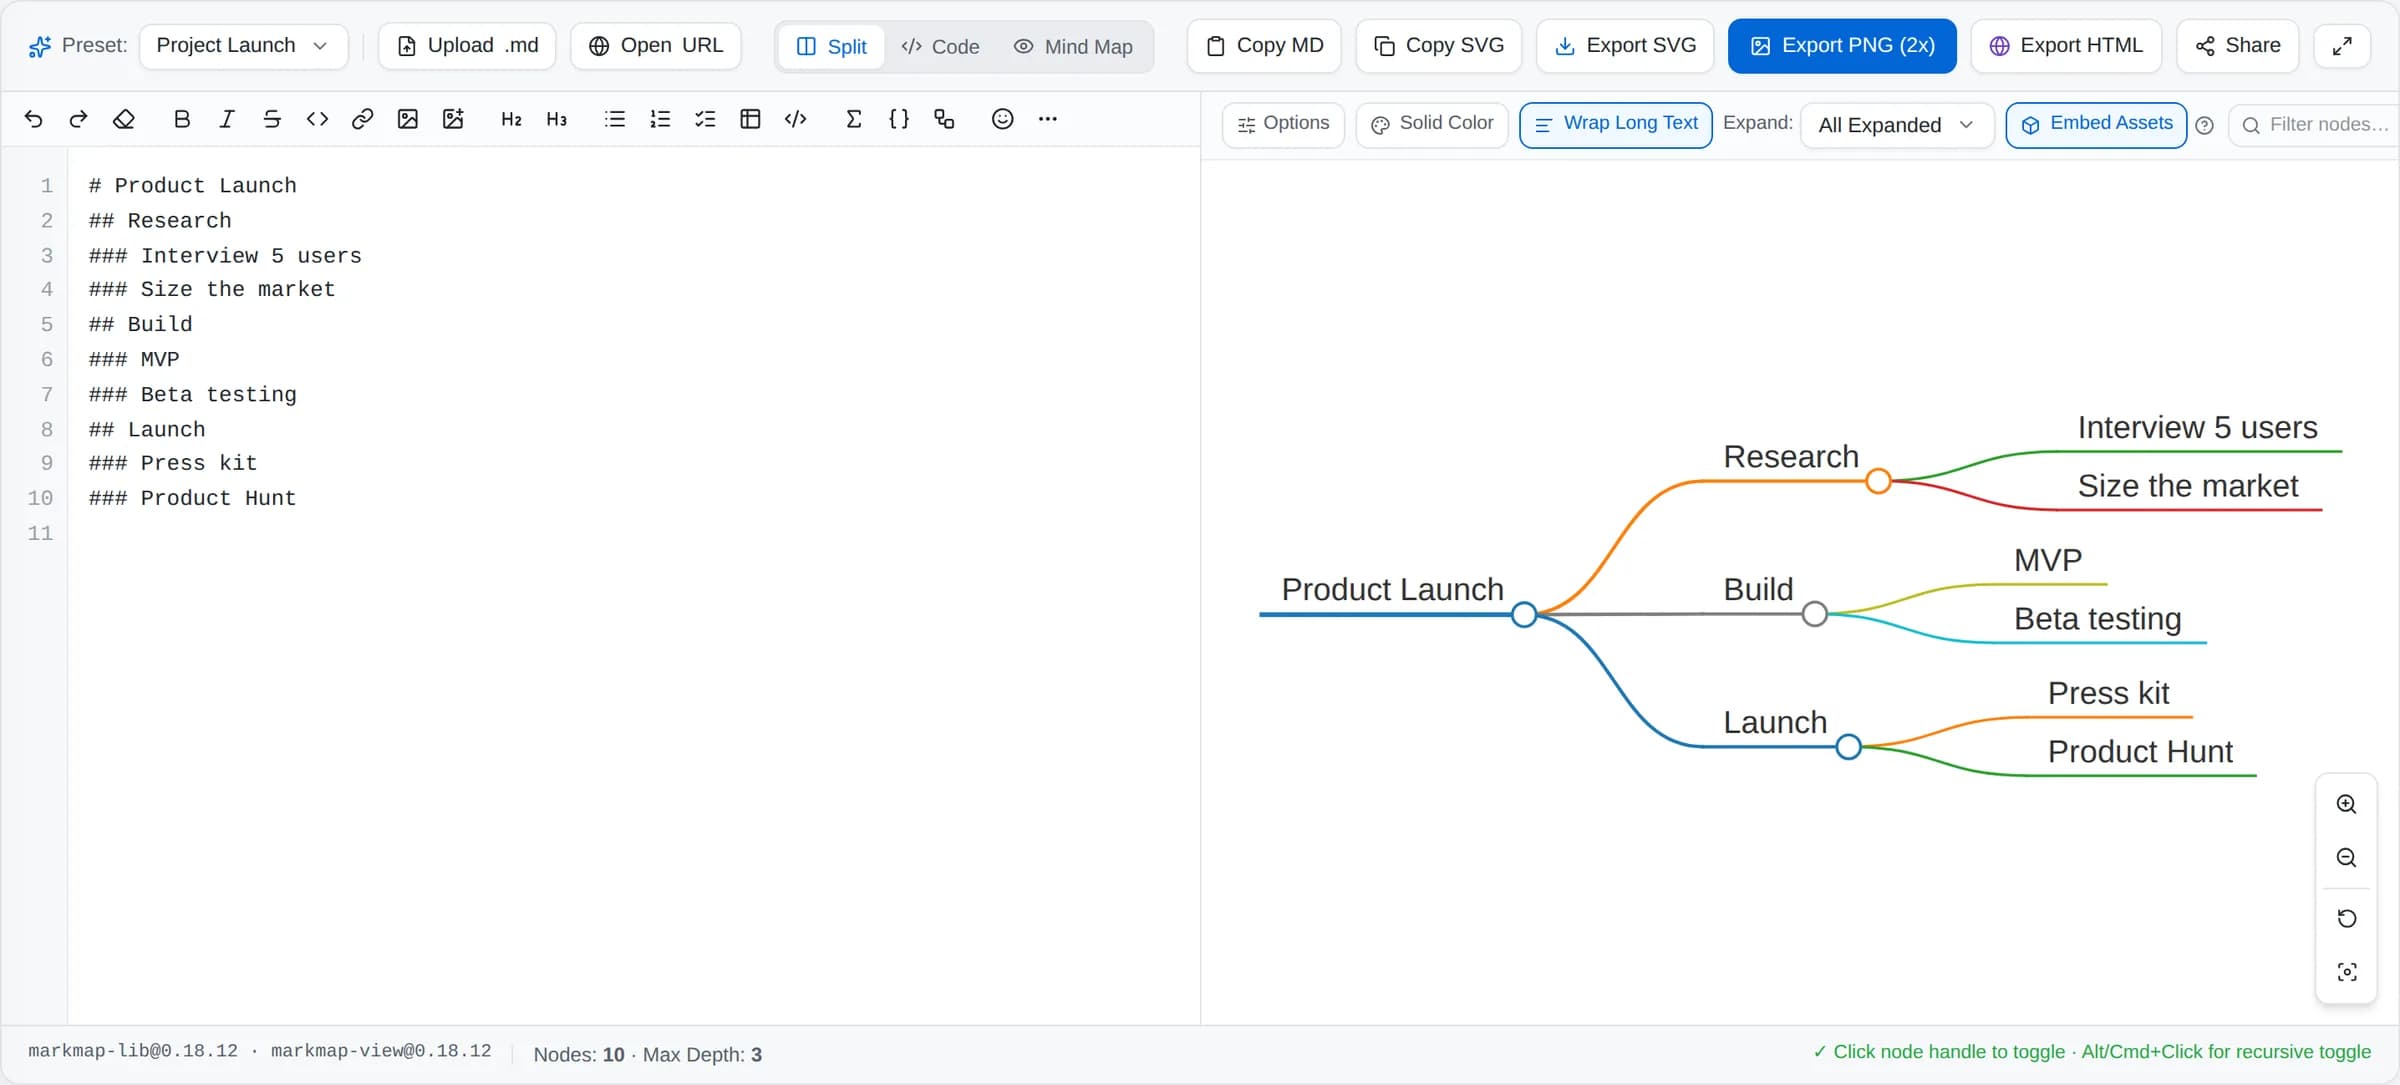
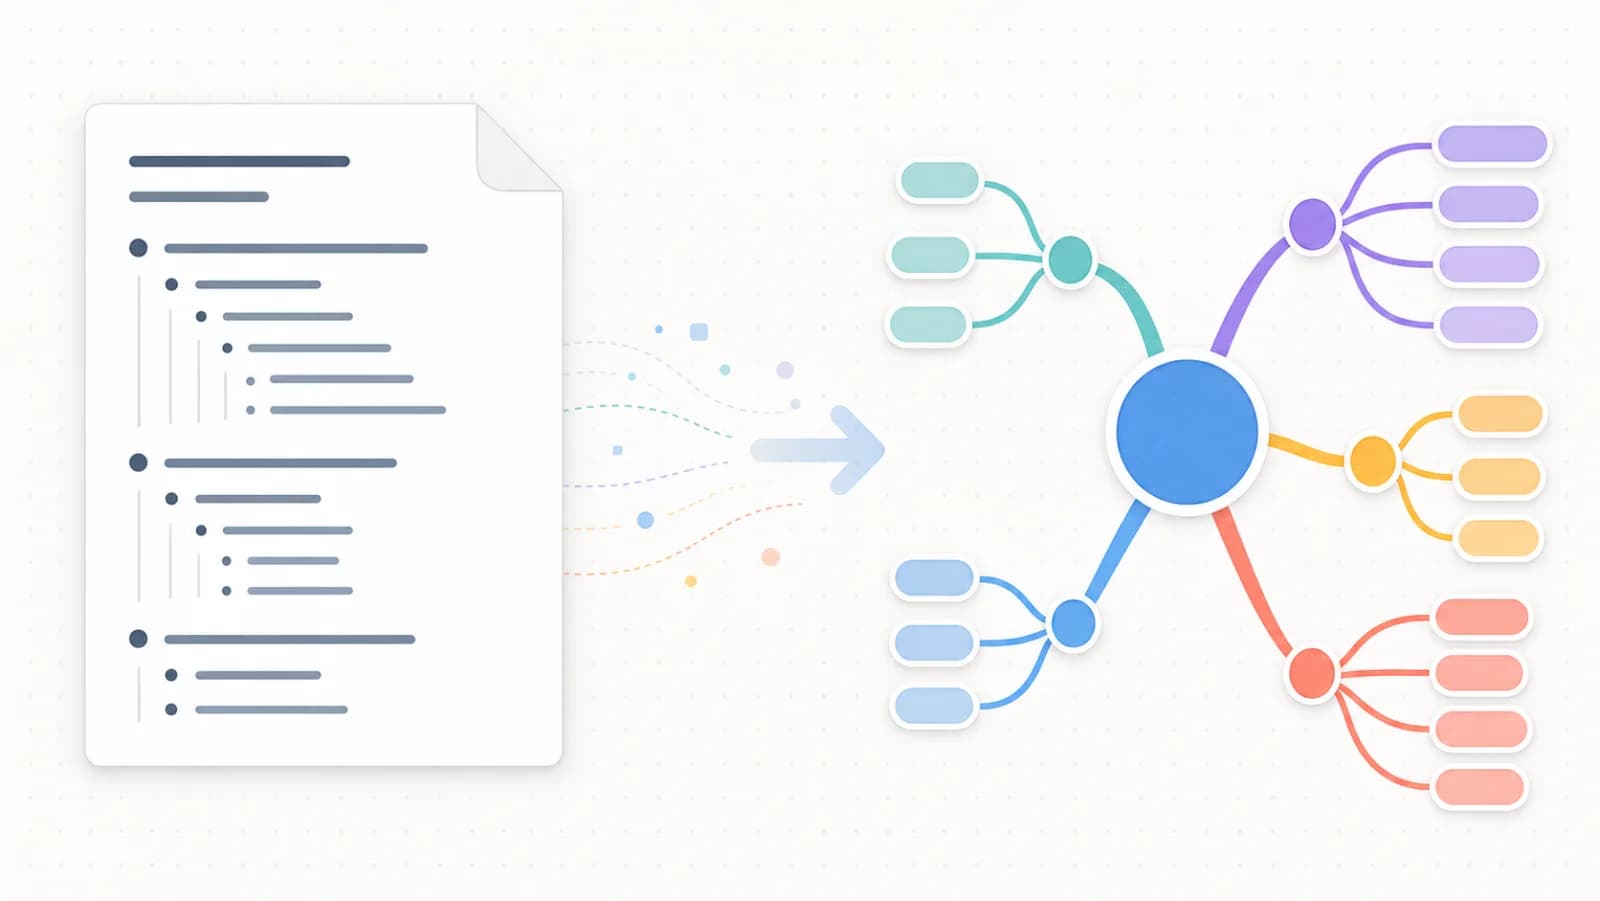
Mind-mapping apps ask you to start over. You have perfectly good meeting notes, a project outline, a set of study notes — and the app hands you an empty canvas and a “new node” button. But your outline already contains the whole structure. Headings are branches. Indentation is hierarchy. Nothing needs redrawing; it just needs displaying differently.
What is Markmap?
Markmap is exactly what the name says — Markdown + mindmap. It reads the structure of a Markdown document and renders it as an interactive mind map:
- A
# headingbecomes the root in the centre. ## headingsbecome the main branches.### headingsand nested list items become the leaves.
This is the entire source for the map in the screenshot above:
# Product Launch
## Research
### Interview 5 users
### Size the market
## Build
### MVP
### Beta testing
## Launch
### Press kit
### Product Hunt
Ten lines. No canvas, no dragging, no “add child node”. And because the source is ordinary Markdown, the same file is still a document — you can paste it into a README, e-mail it, or keep editing it as text.
1. Type on the left, watch the map on the right
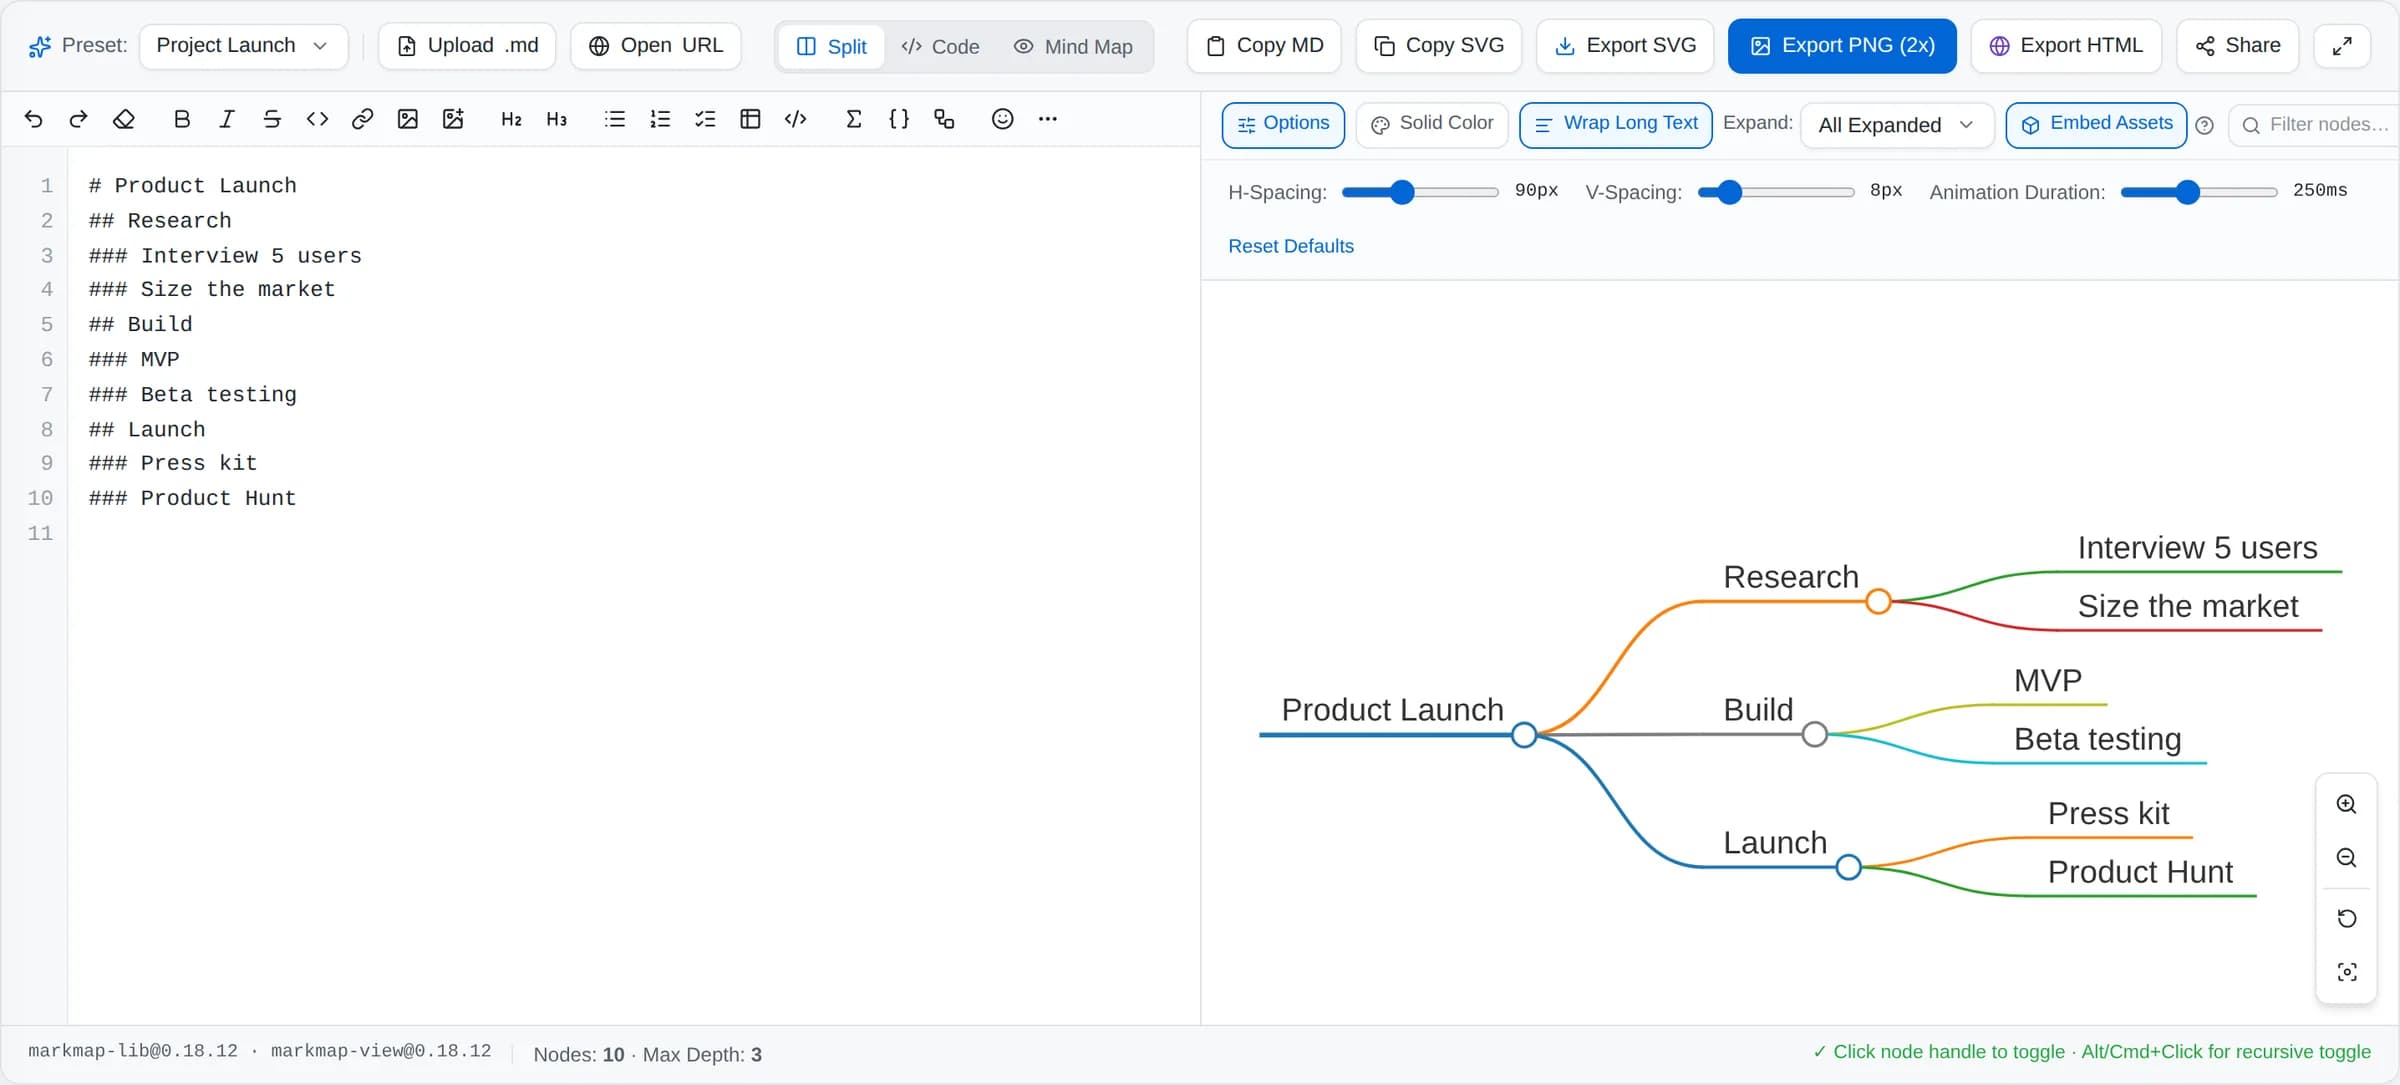
The Markmap Editor is a split screen: Markdown source on the left, live mind map on the right. Add a ### line and a new leaf appears as you type. There is a full formatting toolbar and line numbers, so it works as a normal outline editor too — the map is just a second view of the same text.
On the canvas itself, drag to pan and scroll to zoom. Click the small circle on a branch to fold it away; Alt- or Cmd-click folds the whole sub-tree at once. Folding is how a 200-line outline stays readable — collapse everything, then open only the branch you are discussing.
2. Control how much detail is showing
The Expand dropdown sets how deep the map opens by default — first level only, two levels, or all expanded. This is the single most useful control in the tool, and it maps neatly onto how you actually present:
- Level 1 — the shape of the whole project on one screen. Good for an opening slide.
- Level 2 — themes and their main pieces. Good for a status update.
- All expanded — the full detail, for working through it yourself.
3. Colour that carries meaning
By default every branch gets its own colour, so your eye can follow one line of thinking across a busy canvas. Two controls change that:
- Solid Color paints the whole map in a single colour — the right choice for printing, or when a brand palette says one accent only.
- Color Freeze Level stops introducing new colours after a chosen depth, so everything under “Research” stays the same colour. Use it when the top-level split is the thing you want people to see.
4. Find a node in a large map
Once a map passes a hundred nodes, scanning stops working. The Filter nodes box narrows the map to matching nodes as you type, so “budget” pulls that one leaf out of a sprawling plan. It is the fastest way back into a document you wrote three weeks ago.
5. Export — including one file anyone can open
Four ways out, and the third is the interesting one:
- SVG — vector, scales to any size, drops into design tools.
- PNG at 2x — a retina-sharp bitmap for slides and docs.
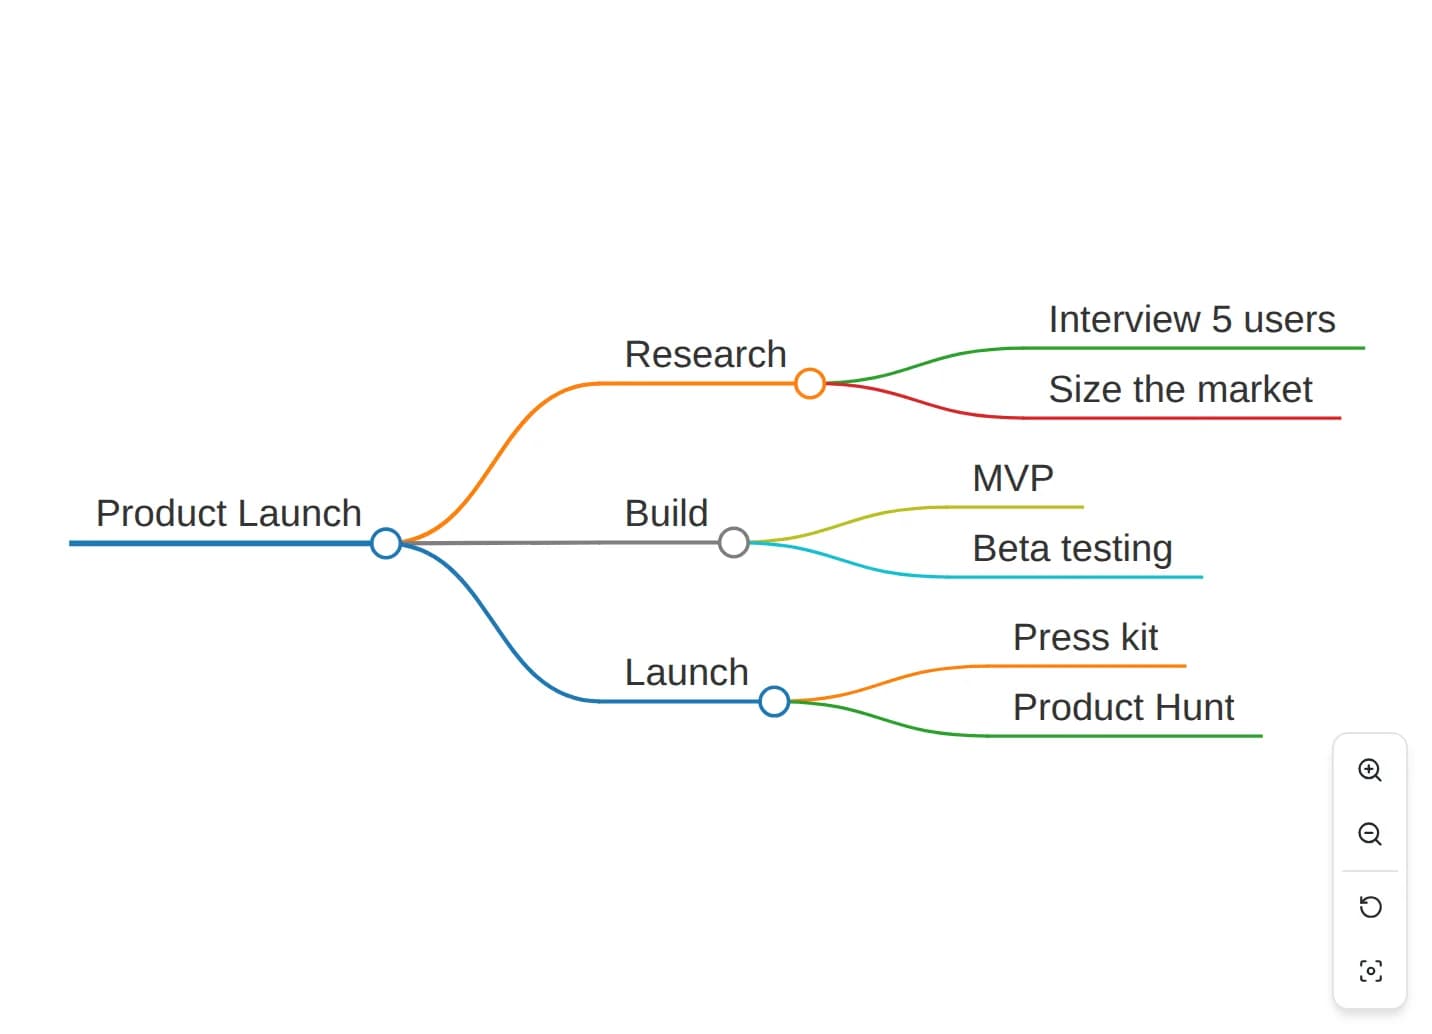
- Interactive HTML — a single self-contained file. Send it to someone and they can pan, zoom and fold branches themselves, in any browser, with nothing installed. A mind map that stays a mind map instead of flattening into a picture.
- Share link — the document is packed into the URL itself, so a teammate opens it already editable.
You can also bring documents in: upload a .md file, or use Open URL to pull in a README or any public Markdown file and see its structure at a glance.
Where this actually helps
- Meeting notes → a shareable summary. You already typed the notes as an outline. Export the interactive HTML and send that instead of a wall of bullets.
- Studying. Turn chapter notes into a map, fold it to level 1, and use it to test whether you can expand each branch from memory.
- Understanding a big README. Paste a project’s README in and read its architecture as a shape rather than 600 lines of prose.
- Planning. Draft the outline as text — which is faster than dragging boxes — and use the map to spot the branch that is suspiciously thin.
A note on privacy
Parsing and rendering happen inside your browser tab, and your work is autosaved to that browser only. Nothing is uploaded, so meeting notes, interview transcripts and unannounced plans stay on your machine.
Frequently asked questions
What is Markmap?
Markmap is Markdown + mindmap. It reads the heading and list structure you already wrote in a Markdown document and draws it as an interactive mind map — a # heading becomes the root, ## headings become the main branches, and nested list items become leaves. You never draw anything by hand.
Do I have to rewrite my notes in a special format?
No. Any Markdown outline works, because the structure is already there. If your document uses headings and bullet lists, it is already a mind map — Markmap just shows it that way.
Can I share a mind map with someone who does not use the tool?
Yes. Export as Interactive HTML and you get a single self-contained file. Whoever opens it can pan, zoom and fold branches in their own browser without installing anything. There is also SVG, 2x PNG, and a share link that packs the document into the URL itself.
What do the colours mean?
By default each branch gets its own colour so you can follow a line of thinking across the canvas. Solid Color mode paints everything one colour for print or a strict brand palette, and Color Freeze Level stops recolouring after a chosen depth so a whole sub-tree stays visually together.
Is my document uploaded anywhere?
No. The outline is parsed and drawn inside your browser tab, and your work is autosaved to that browser only. Nothing is sent to a server, so meeting notes and unreleased plans stay on your machine.